
01
Data-driven catchments
Build trade areas from observed customer origins instead of arbitrary radius or drive-time rings.
Use case / Retail Trade Area Analysis
Define catchments around stores, see where customers travel from and understand which areas drive visits. Spotzi turns mobility, household and points-of-interest data into trade areas your retail, media and expansion teams can act on.
Customer origins / catchment overlap / local audience planning
What the analysis improves
Fixed rings are easy to draw, but customers rarely behave like a perfect circle. Spotzi builds trade areas from observed movement and the places that shape the journey.
From signal to store visit
Build trade areas from observed customer origins instead of arbitrary radius or drive-time rings.
See which neighbourhoods, cities and regions generate visits and how far customers travel.
Compare catchments across stores to spot overlap, gaps and locations that compete for the same demand.
Turn catchment insights into local media, assortment and activation decisions.
A ten-minute ring is easy to draw, but customers rarely behave like a perfect circle. Trade areas built from observed movement show the neighbourhoods that actually generate visits, the competitors customers consider and the areas where demand is underserved.
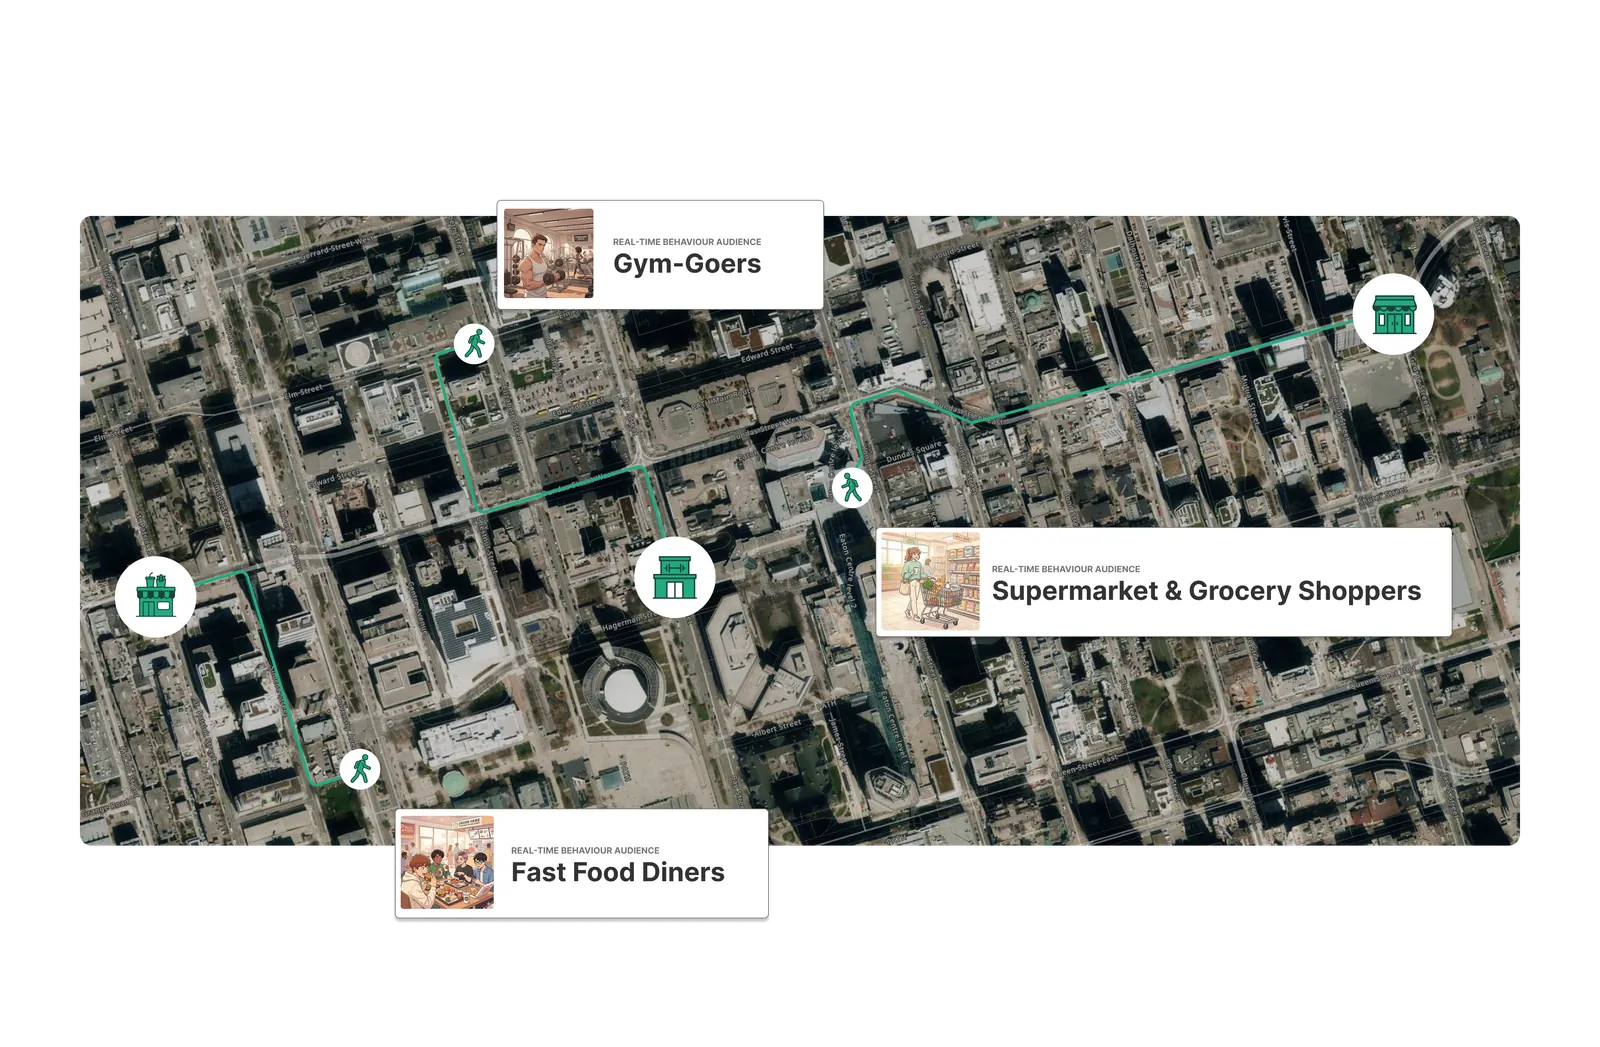
Map the neighbourhoods and regions that generate visits, rather than assuming demand stops at a fixed radius.
Compare travel patterns by store, format and market to see what a realistic catchment looks like.
Compare catchments across the network to find overlap, gaps and opportunities for new locations or local marketing.
See how demand changes between formats, dayparts and time periods so local plans reflect real behaviour.
Turn catchment insights into audience segments for local media, CRM and activation.
A retail trade area is the geographic area from which a store draws most of its customers. It can be based on drive times, observed customer origins or a combination of both.
A radius assumes distance is the only driver. Observed trade areas account for competition, transport, destinations and real travel behaviour.
Yes. Catchments can be compared across formats, markets and store sizes, provided the underlying data coverage is sufficient.
Yes. Customer and loyalty data can be combined with mobility data to make the catchment more specific to your business.
Maps, catchment profiles, customer-origin analysis, overlap and cannibalisation views, and audience segments for local planning.
The decision layer for real-world marketing
Share a store, a market or a store network. We will show you how a trade area analysis changes the picture.
Spotzi in numbers
700M+
people in motion daily
5,000+
audiences
Millions
points of interest